pixelpulse
Visualize and control in real-time
Pixelpulse makes it easy to experiment using cee.
Simple yet powerful user interface to control and explore whatever's connected.
Pixelpulse exposes the functionality of the CEE for interactive use. It's a web app, so it runs identically on Windows, Linux, and Mac, harnessing the latest in HTML5 technologies to create a fluid experience.
If you have a CEE, launch Pixelpulse »
Quickly experiment
Just click to source voltage or current, and watch what happens.
Generate Signals
Choose a function — ![]() , adjust parameters, and make waves.
, adjust parameters, and make waves.
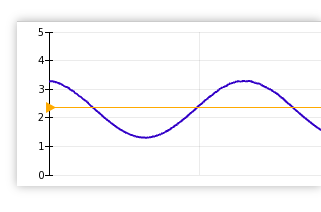
Zoom & Explore
Pause, double click to zoom in, then drag to pan.
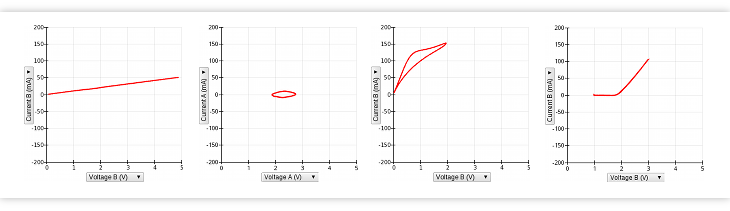
Plot Sidebar
Add configurable graphs for curve tracing, phase plotting, or comparing channels. Visualize component characteristics and hysteresis live.
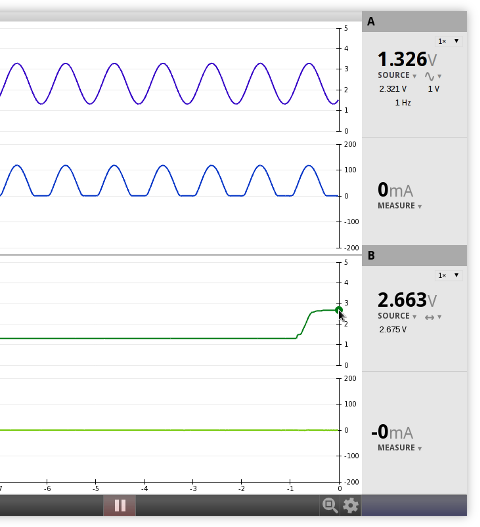
Triggering
Capture repeating signals with triggering, like an oscilloscope. Automatically adjust to syncronize with generated output signals. Pan, zoom, and change trigger level & source, all with the mouse.